Stop pasting screenshots into Claude — give your AI agent the actual bug
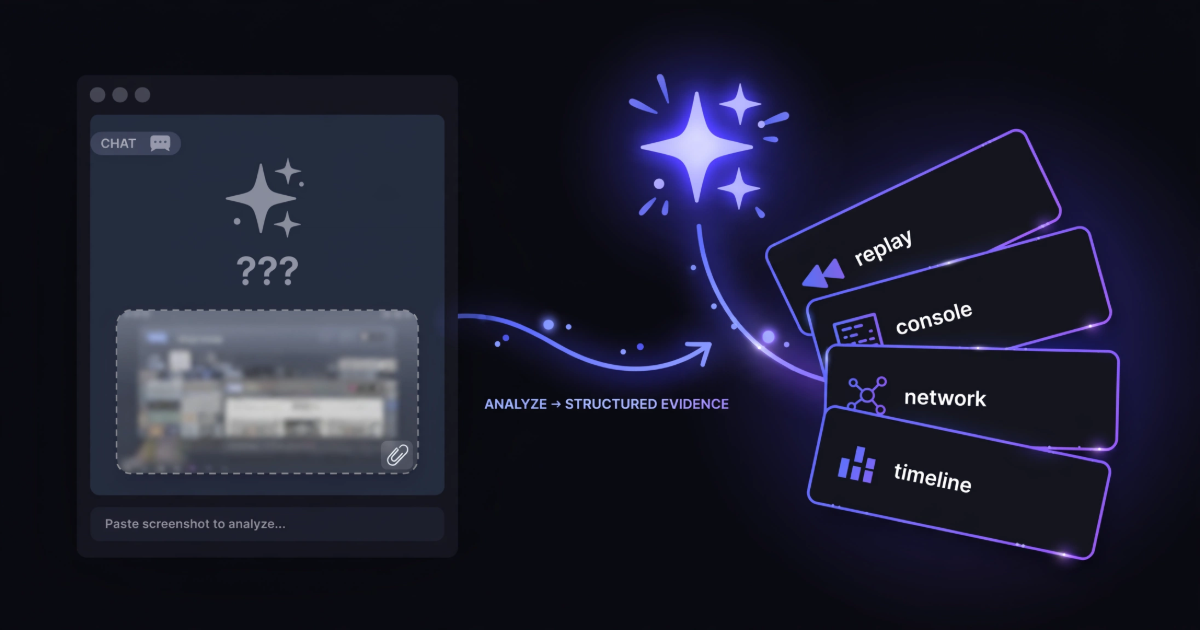
AI coding agents are only as good as their evidence. Paste a screenshot of a broken checkout into a chat and the model gets pixels: no stack trace, no failing request, no idea what the user clicked. It will guess — confidently — and you'll spend the next twenty minutes correcting the guesses.
The fix isn't a smarter prompt. It's better evidence. Here's the two-minute setup that hands Claude Code, Cursor, or Windsurf everything a human debugger would want: the session replay, console errors with stack traces, failed network requests, and a millisecond-resolution timeline of what the user actually did.
Step 1 — Capture the bug (2 clicks)
Install the TraceBug extension (free, no account) or add tracebug-sdk to your app. When a bug happens: start a capture, reproduce it, click capture. TraceBug records the DOM session, console, and network locally — nothing is uploaded anywhere.
Step 2 — Export one file
Click Export .html. You get a single self-contained file — replay, errors, requests, timeline, environment — that opens offline in any browser. Typically under a megabyte thanks to gzip-compressed DOM events.
Step 3 — Register the MCP server (once, ever)
claude mcp add tracebug -- npx -y tracebug mcp
That's the whole setup. The server runs locally and auto-discovers exports in your Downloads and Desktop folders — no paths to configure. Cursor and VS Code users: the hand-off card in TraceBug shows the equivalent one-liner for each tool.
What the agent can do now
Your agent gets five tools: list_bug_reports, get_bug_report (which includes a prioritized investigation guide), get_console_errors, get_network_activity, and get_repro_steps. It reads the evidence, cross-references your codebase, and starts from the actual failing line instead of a guess.
We ran this exact flow and published the unedited transcript: five tool calls from crash to root cause, including the stack trace that named the file and line, and the diagnosis that followed. Read the real transcript →
No MCP? There's a chat path too
If you just want to paste into a chat window, don't upload the replay file — it's built for browsers and MCP, not context windows. Use AI report (.html) or Download report (.md) from the More menu instead: a few KB of structured plain text that fits any model's context.
Why local matters
The whole pipeline — capture, export, MCP server — runs on your machine. Bug reports contain your app's DOM, your network payloads, your users' sessions. With TraceBug that evidence goes from your browser to your disk to your agent, and nowhere else. It's MIT-licensed open source; audit it.